Aaron Conklin |UW Madison

Appropriately, the entire idea was inspired by a massive amount of snowfall.
Back in 2007, Ankur Desai came to UW-Madison to join the Department of Atmospheric and Oceanic Sciences (AOS) – just in time to experience a historic winter that saw more than 100 inches of snow deluge the city. The impact of “Snowmageddon,” as it was dubbed by Madisonians, proved both immediate (the department’s annual Winter Solstice party had to be scrapped) and, as it turns out, far-reaching.
“It really got me thinking about forecasting snowstorms,” says Desai, a professor of atmospheric and oceanic sciences. His interest peaked even further the following year, when Madison was hit, not by another blizzard, but by an almost daily stream of smaller snowfalls.
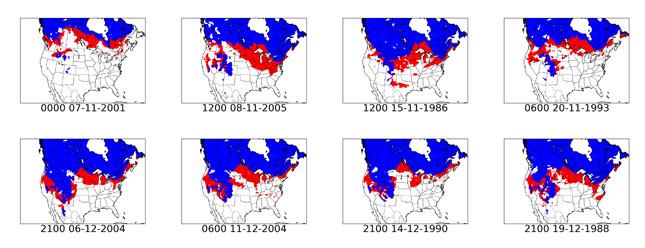
Desai studies the ways vegetation, precipitation and snow cover influence the atmosphere-and what that means for long-term climate prediction. Though not a weather systems expert, he noticed that the computer forecast models that tracked storms along the snow line, the place where snow cover gives way to bare ground, seemed to be the most accurate. He also noted a longstanding belief among meteorologists that the strongest, most intense snowstorms in the United States were drawn to the area around the snow line. He wondered if research might show that this was the case.
“The boundary acts as a kind of difference between cold and warm air,” explains Desai. “Differences in temperature are what drive weather in the atmosphere. So my initial thought was that this strong difference would lead to intensification.”
Desai also knew that warming winters are projected to cause the snow line to shift northward, in some scenarios by as much as 1,000 kilometers by the late 21st Century. Fueled by a 2016 grant from the National Science Foundation, Desai and a team that included fellow AOS professor Jonathan Martin set out to see if severe snowstorms were, in fact, gravitating to, and following, the path of that shifting snow line. Desai characterizes the project as the classic butterfly effect story: Examining whether small changes in snow cover are influencing the three-to-five-day trajectory of the weather.
Desai asked UW graduate student Ryan Clare to run 500 storm simulations based on decades of weather data compiled by the National Oceanic and Atmospheric Administration (NOAA)’s National Climate Data Center. The area the team studied ran from the Rocky Mountains to the Atlantic Coast, with a primary focus on the Great Plains. Clare initiated each of his simulations several days prior to the arrival of each storm to zero in on the direct influence snow cover was or was not having on the storm’s trajectory and intensity.
“The idea was, let’s look at a whole bunch of different storms: Alberta Clippers that come down from Canada, these Oklahoma Hooks that form in the lee of the Rocky Mountains,'” says Desai. “And let’s, for each one of those, modify some of the initial conditions-realistically move the snow line-to simulate what we would expect in a future warmer climate.”
The questions were straightforward: Does a shift in the snow line change where the storms are occurring? And do the storms become more intense around that line?
What Desai and his colleagues found was more subtle than they had expected. The storms didn’t necessarily follow the snow line once it shifted, and the amount of precipitation in the storms increased-and the storms were more likely to rain than snow.
“In the places where’s there’s no snow on the ground, there’s a warmer and moister environment,” he says. “And that fuels the growth of the storms. The storms are then more likely to produce rain than snow, even though the thermodynamics are the same. So having snow on the ground actually influences some features of the precipitation type.”
Snow cover-or the lack of it-has other potential impacts on human activities like agriculture and road travel. While the air is warmer below the snow line, the ground is often colder than the snow-covered ground above the snow line, because snow acts an insulator. Studies by other researchers have suggested that less snow cover and colder ground could lead to an increase in runoff.
‘If we have these more intense, wetter, rain-on-snow or rain-on-frozen-ground events, flooding risks will likely increase in that kind of a situation,” says Desai.
Weather forecasters have taken note of the team’s findings. Last year, Desai’s group conducted a roundtable discussion with regional broadcast and forecast meteorologists in partnership with Climate Central, an independent group that provides climate-related graphics to broadcasters.
“It was really interesting to see how eager many of the meteorologists were to get some of the basic facts of climate change, as well as information about how to communicate those impacts, because the public wants that information,” says Desai.
Other researchers are already looking at the data set Clare produced with the storm simulations, looking at the impacts on moisture flux in the atmosphere and temperature in the areas where snow cover has disappeared. Desai is hoping to share the team’s findings with meteorologists at a national level and recruit undergraduates in his annual measurements class to conduct more observational field research, the better to get a sense of what exactly is happening when the snow melts and the snow line moves northward.
It’s that micrometeorology angle that defines the broader impact of Desai’s work-the notion that studying the characteristics of an individual storm or the impacts on an individual area provides a very different understanding than studying only a big-picture climate model.
“If you want to understand the frequency of independent, individual weather systems and the effect of that on an ecosystem and human activity, you really do need to think very specifically about weather,” he says. “We respond to weather, not climate.”


