Computational photography could solve a problem that bedevils self-driving cars.
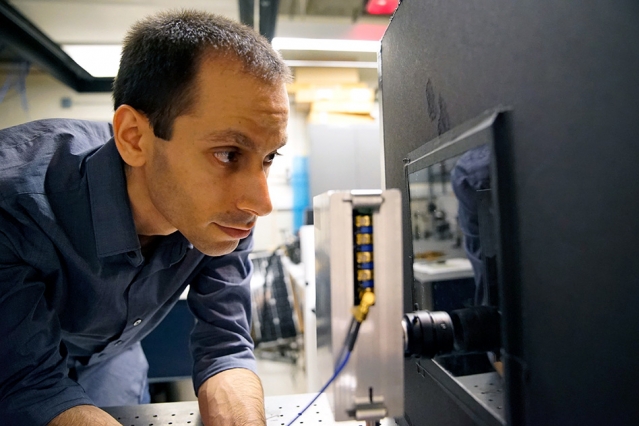
Image: Melanie Gonick/MIT
CAMBRIDGE, MASS.–MIT researchers have developed a system that can produce images of objects shrouded by fog so thick that human vision can’t penetrate it. It can also gauge the objects’ distance.
An inability to handle misty driving conditions has been one of the chief obstacles to the development of autonomous vehicular navigation systems that use visible light, which are preferable to radar-based systems for their high resolution and ability to read road signs and track lane markers. So, the MIT system could be a crucial step toward self-driving cars.
The researchers tested the system using a small tank of water with the vibrating motor from a humidifier immersed in it. In fog so dense that human vision could penetrate only 36 centimeters, the system was able to resolve images of objects and gauge their depth at a range of 57 centimeters.
Fifty-seven centimeters is not a great distance, but the fog produced for the study is far denser than any that a human driver would have to contend with; in the real world, a typical fog might afford a visibility of about 30 to 50 meters. The vital point is that the system performed better than human vision, whereas most imaging systems perform far worse. A navigation system that was even as good as a human driver at driving in fog would be a huge breakthrough.
“I decided to take on the challenge of developing a system that can see through actual fog,” says Guy Satat, a graduate student in the MIT Media Lab, who led the research. “We’re dealing with realistic fog, which is dense, dynamic, and heterogeneous. It is constantly moving and changing, with patches of denser or less-dense fog. Other methods are not designed to cope with such realistic scenarios.”
Satat and his colleagues describe their system in a paper they’ll present at the International Conference on Computational Photography in May. Satat is first author on the paper, and he’s joined by his thesis advisor, associate professor of media arts and sciences Ramesh Raskar, and by Matthew Tancik, who was a graduate student in electrical engineering and computer science when the work was done.
Playing the odds
Like many of the projects undertaken in Raskar’s Camera Culture Group, the new system uses a time-of-flight camera, which fires ultrashort bursts of laser light into a scene and measures the time it takes their reflections to return.
On a clear day, the light’s return time faithfully indicates the distances of the objects that reflected it. But fog causes light to “scatter,” or bounce around in random ways. In foggy weather, most of the light that reaches the camera’s sensor will have been reflected by airborne water droplets, not by the types of objects that autonomous vehicles need to avoid. And even the light that does reflect from potential obstacles will arrive at different times, having been deflected by water droplets on both the way out and the way back.
The MIT system gets around this problem by using statistics. The patterns produced by fog-reflected light vary according to the fog’s density: On average, light penetrates less deeply into a thick fog than it does into a light fog. But the MIT researchers were able to show that, no matter how thick the fog, the arrival times of the reflected light adhere to a statistical pattern known as a gamma distribution.
Gamma distributions are somewhat more complex than Gaussian distributions, the common distributions that yield the familiar bell curve: They can be asymmetrical, and they can take on a wider variety of shapes. But like Gaussian distributions, they’re completely described by two variables. The MIT system estimates the values of those variables on the fly and uses the resulting distribution to filter fog reflection out of the light signal that reaches the time-of-flight camera’s sensor.
Crucially, the system calculates a different gamma distribution for each of the 1,024 pixels in the sensor. That’s why it’s able to handle the variations in fog density that foiled earlier systems: It can handle circumstances in which each pixel sees a different type of fog.
Signature shapes
The camera counts the number of light particles, or photons, that reach it every 56 picoseconds, or trillionths of a second. The MIT system uses those raw counts to produce a histogram — essentially a bar graph, with the heights of the bars indicating the photon counts for each interval. Then it finds the gamma distribution that best fits the shape of the bar graph and simply subtracts the associated photon counts from the measured totals. What remain are slight spikes at the distances that correlate with physical obstacles.
“What’s nice about this is that it’s pretty simple,” Satat says. “If you look at the computation and the method, it’s surprisingly not complex. We also don’t need any prior knowledge about the fog and its density, which helps it to work in a wide range of fog conditions.”
Satat tested the system using a fog chamber a meter long. Inside the chamber, he mounted regularly spaced distance markers, which provided a rough measure of visibility. He also placed a series of small objects — a wooden figurine, wooden blocks, silhouettes of letters — that the system was able to image even when they were indiscernible to the naked eye.
There are different ways to measure visibility, however: Objects with different colors and textures are visible through fog at different distances. So, to assess the system’s performance, he used a more rigorous metric called optical depth, which describes the amount of light that penetrates the fog.
Optical depth is independent of distance, so the performance of the system on fog that has a particular optical depth at a range of 1 meter should be a good predictor of its performance on fog that has the same optical depth at a range of 30 meters. In fact, the system may even fare better at longer distances, as the differences between photons’ arrival times will be greater, which could make for more accurate histograms.


