The resistance that infectious microbes have to antibiotics makes it difficult for physicians to confidently select the right drug to treat an infection. And that resistance is dynamic: It changes from year to year and varies across a region.
To help choose the best antibiotic first, researchers at the University of Wisconsin–Madison are drawing inspiration from another dynamic process — the weather.
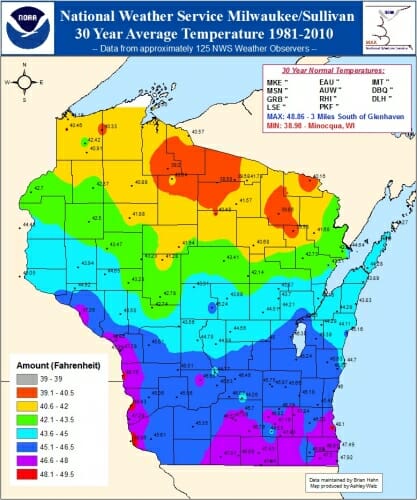
The researchers, at the UW–Madison School of Pharmacy and the State Cartographer’s Office, are developing a visual display of antibiotic resistance data across Wisconsin. By showing where in the state resistance to particular drugs is highest and making the information as easy to read as a weather map, the researchers aim to give physicians the tools they need to quickly and accurately choose the best antibiotic.
Hospitals and public health officials have collected data on which microbes — bacteria and infectious fungi and yeast, mostly — are resistant to particular antibiotics for decades. That information shows that resistance varies by location and is influenced by antibiotic use and other factors. Urban centers have different resistant microbes than rural areas, and the patterns fluctuate as you move across a region.
But the dense table that hospitals organize the information into is time-consuming and tedious to interpret. And hospitals might only have access to their own information, not a statewide outlook.

Comparative Health Systems Global Pharmacy Fellow Laurel Legenza and School of Pharmacy associate professors Warren Rose and Susanne Barnett wanted to find ways to improve how physicians use this critical information. As part of their efforts, they surveyed health care providers to assess their use of antibiotic resistance data and inform improvements.
Then, along with Rose, Barnett, and Associate State Cartographer Jim Lacy, Legenza developed the idea to put together the information in a more user-friendly and helpful format. Legenza and Natalee Desotell, a geographic information systems master’s student, created the first interactive Wisconsin antibiotic resistance visualizations. The project won funding from the 2017 Fall Research Competition of the Office of the Vice Chancellor for Research and Graduate Education.
“We want to create dynamic visualizations that are not only showing this data in a way that hasn’t been shown before in our state, but also is very intuitive, so it’s like looking at a weather map,” says Legenza.
The final product will allow physicians and other health care providers to quickly look up the patterns of resistance in the community where their patient lives. That will help them select the right antibiotic the first time.
“Choosing the appropriate antibiotic is really important, because if we get it wrong, then it could lead to very poor outcomes,” says Barnett.

Beyond antibiotic resistance, Legenza and the research team plan to incorporate information on antibiotic sales, demographic data, and the site of the infection — all of which will allow the new tool to assist with making a decision on which antibiotic is best for each particular patient and predict resistance trends.
The research team is currently collecting resistance data from 2017 to add to existing data they have assembled from 2009, 2013 and 2015. The 2017 data will be gathered with more patient information, helping tailor antibiotic recommendations to the local community where a patient lives.
That more detailed data will allow the researchers to “with a fine grain of detail, map the spatial patterns of what’s happening around the state,” Lacy says. Lacy adds that the program will give practical experience in data mapping to students in the State Cartographer’s Office, which is housed in the UW–Madison Department of Geography.
Over the next 18 months, the team will assemble the data and prototype the map that will present the information to physicians. The goal is that, before too long, physicians across Wisconsin can improve their patients’ outcomes by tracking antibiotic resistance as easily as they track a storm.


