NuSTAR Stares at the Sun

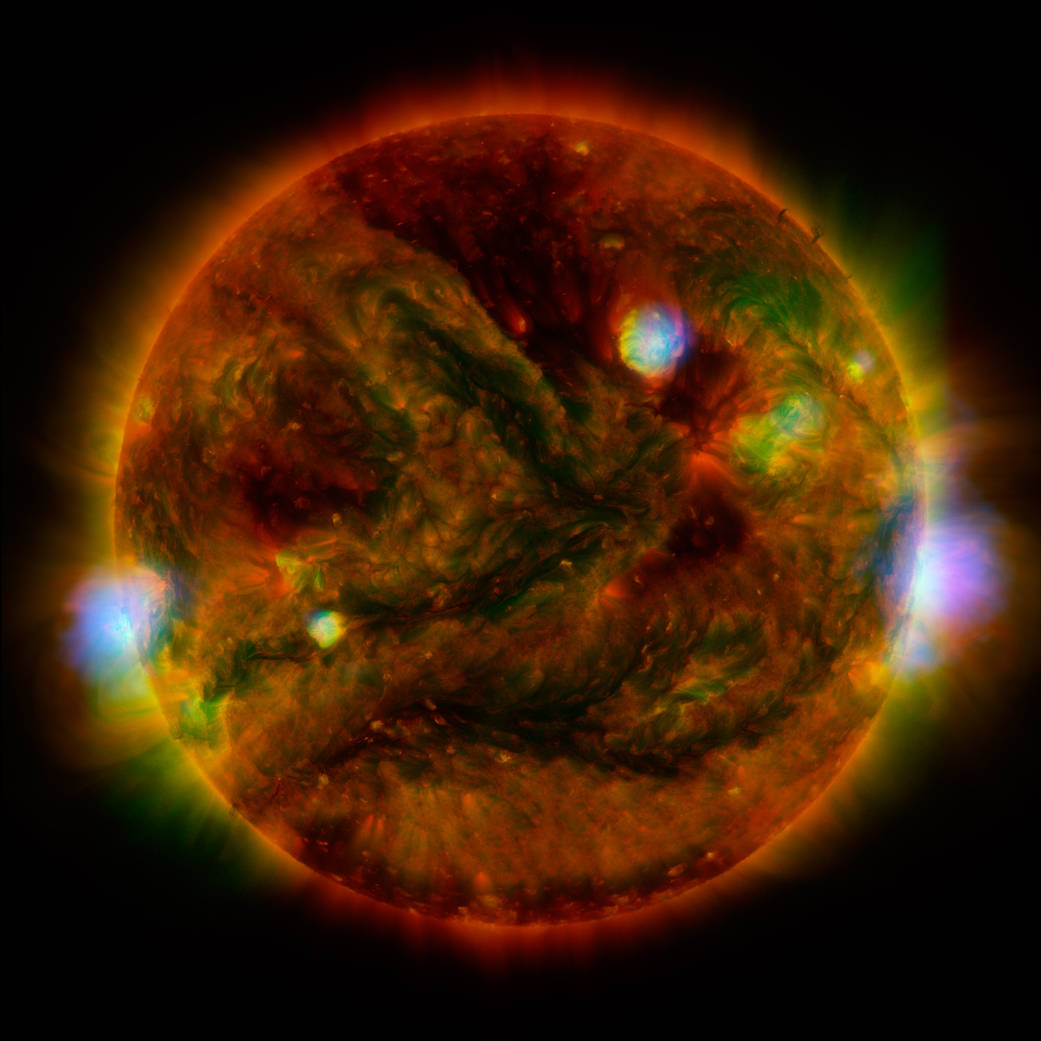
Flaring, active regions of our sun are highlighted in this new image combining observations from several telescopes. High-energy X-rays from NASA’s Nuclear Spectroscopic Telescope Array (NuSTAR) are shown in blue; low-energy X-rays from Japan’s Hinode spacecraft are green; and extreme ultraviolet light from NASA’s Solar Dynamics Observatory (SDO) is yellow and red.
All three telescopes captured their solar images around the same time on April 29, 2015. The NuSTAR image is a mosaic made from combining smaller images.
The active regions across the sun’s surface contain material heated to several millions of degrees. The blue-white areas showing the NuSTAR data pinpoint the most energetic spots. During the observations, microflares went off, which are smaller versions of the larger flares that also erupt from the sun’s surface. The microflares rapidly release energy and heat the material in the active regions.
NuSTAR typically stares deeper into the cosmos to observe X-rays from supernovas, black holes and other extreme objects. But it can also look safely at the sun and capture images of its high-energy X-rays with more sensitivity than before. Scientists plan to continue to study the sun with NuSTAR to learn more about microflares, as well as hypothesized nanoflares, which are even smaller.
In this image, the NuSTAR data shows X-rays with energies between 2 and 6 kiloelectron volts; the Hinode data, which is from the X-ray Telescope instrument, has energies of 0.2 to 2.4 kiloelectron volts; and the Solar Dynamics Observatory data, taken using the Atmospheric Imaging Assembly instrument, shows extreme ultraviolet light with wavelengths of 171 and 193 Angstroms.
Note the green Hinode image frame edge does not extend as far as the SDO ultraviolet image, resulting in the green portion of the image being truncated on the right and left sides.
Solar Filaments Arrow — One Revolution Later
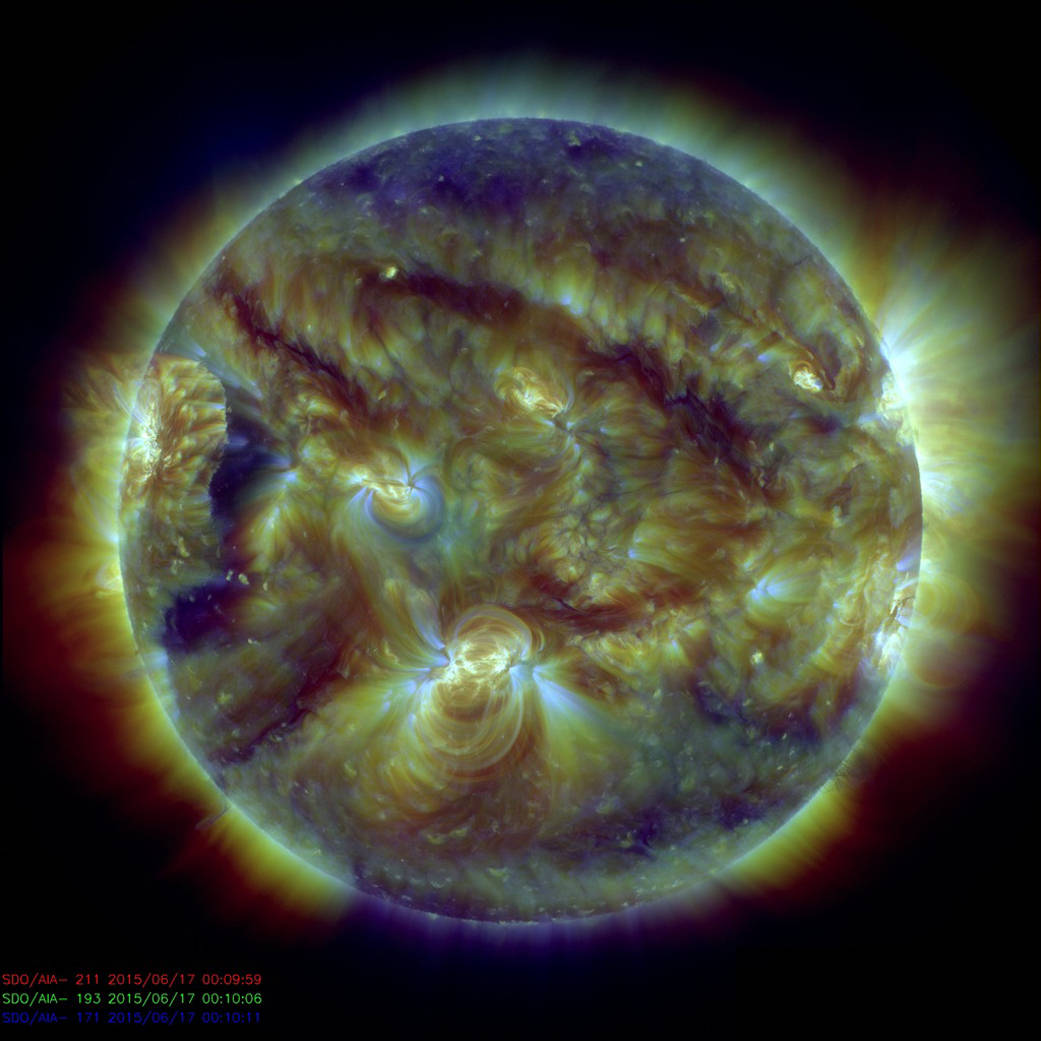
The sun, as seen by NASA’s Solar Dynamics Observatory, or SDO, on June 17, 2015, shows the remains of the two solar filaments that appeared to form an arrow, have survived transitioning around the sun, but the sharpness of the shape has degraded since they were first observed on May 28, 2015. Credit: NASA/SDO
Coronal Loops Over a Sunspot Group
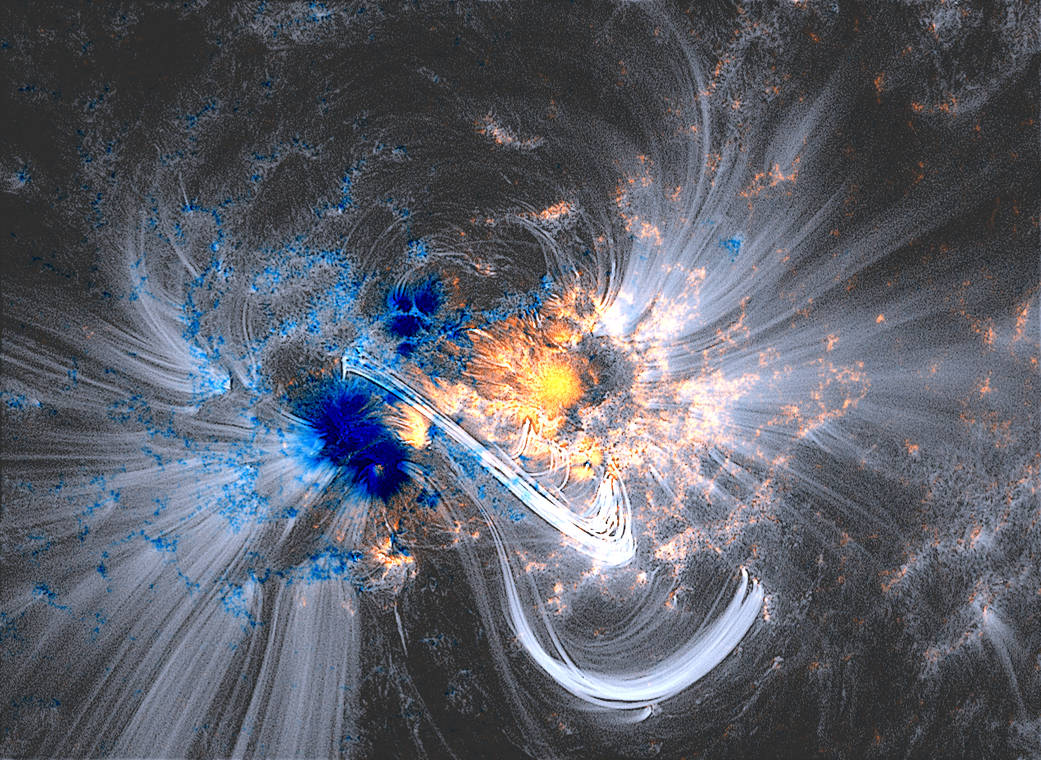
The Atmospheric Imaging Assembly (AIA) instrument aboard NASA’s Solar Dynamics Observatory (SDO) images the solar atmosphere in multiple wavelengths to link changes in the surface to interior changes. Its data includes images of the sun in 10 wavelengths every 10 seconds. When AIA images are sharpened a bit, such as this AIA 171Å channel image, the magnetic field can be readily visualized through the bright, thin strands that are called “coronal loops”. Loops are shown here in a blended overlay with the magnetic field as measured with SDO’s Helioseismic and Magnetic Imager underneath. Blue and yellow represent the opposite polarities of the magnetic field. The combined images were taken on Oct. 24, 2014, at 23:50:37 UT.


